Go to main content

University of Silesia in Katowice

  • Polski
  • English
Institute of Earth Sciences
Logo European City of Science 2024

Reconstruction of the lake bottom relief based on the land subsidence rate (Brandka Pond in Bytom)

20.03.2024 - 15:25 update 20.03.2024 - 15:34
Editors: lukaszmalarzewski

Mining activities lead to subsidence and the formation of anthropogenic reservoirs, such as Brandka Pond in Bytom. An article was published in the journal “Scientifc Reports” in which employees of our Institute proposed a method of reconstructing the relief of the reservoir bottom based on the initial state in 1993 and the calculated subsidence rate. As part of their research, the authors processed archival cartographic materials and digital terrain models from airborne laser scanning. To verify the calculations, they used bathymetric data from 2019 from sonar measurements on the reservoir. The research showed that by 2019 the pond had an area of 178.2 thousand m2, a maximum depth of 5.8 m and capacity of 421.2 thousand m3. The reconstruction method developed by the research team is accurate for lakes over 2 m deep, and the calculated capacity differs from bathymetric data by an average of 0.2%.

Reference: Wita P., Szafraniec J.E., Absalon D., Woźnica A. 2024. Lake bottom relief reconstruction and water volume estimation based on the subsidence rate of the post-mining area (Bytom, Southern Poland). Sci Rep 14, 5230. https://doi.org/10.1038/s41598-024-55963-0

Note author: dr Joanna Szafraniec
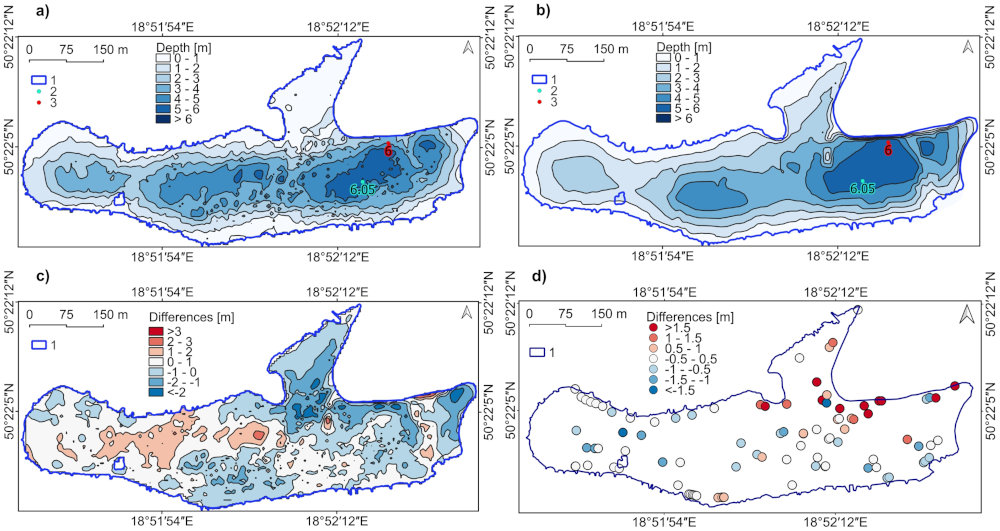
Bathymetry of the Brandka Pond in 2019: (a) pond depth – the bottom relief reconstruction; (b) pond depth – bathymetric measurements in 2019; (c) differences between the reconstructed model and the bathymetric model; (d) differences between raw bathymetric measurements and the reconstruction: 1—Brandka Pond in 2019, 2—deepest point (reconstruction), 3—deepest point (bathymetric measurements).
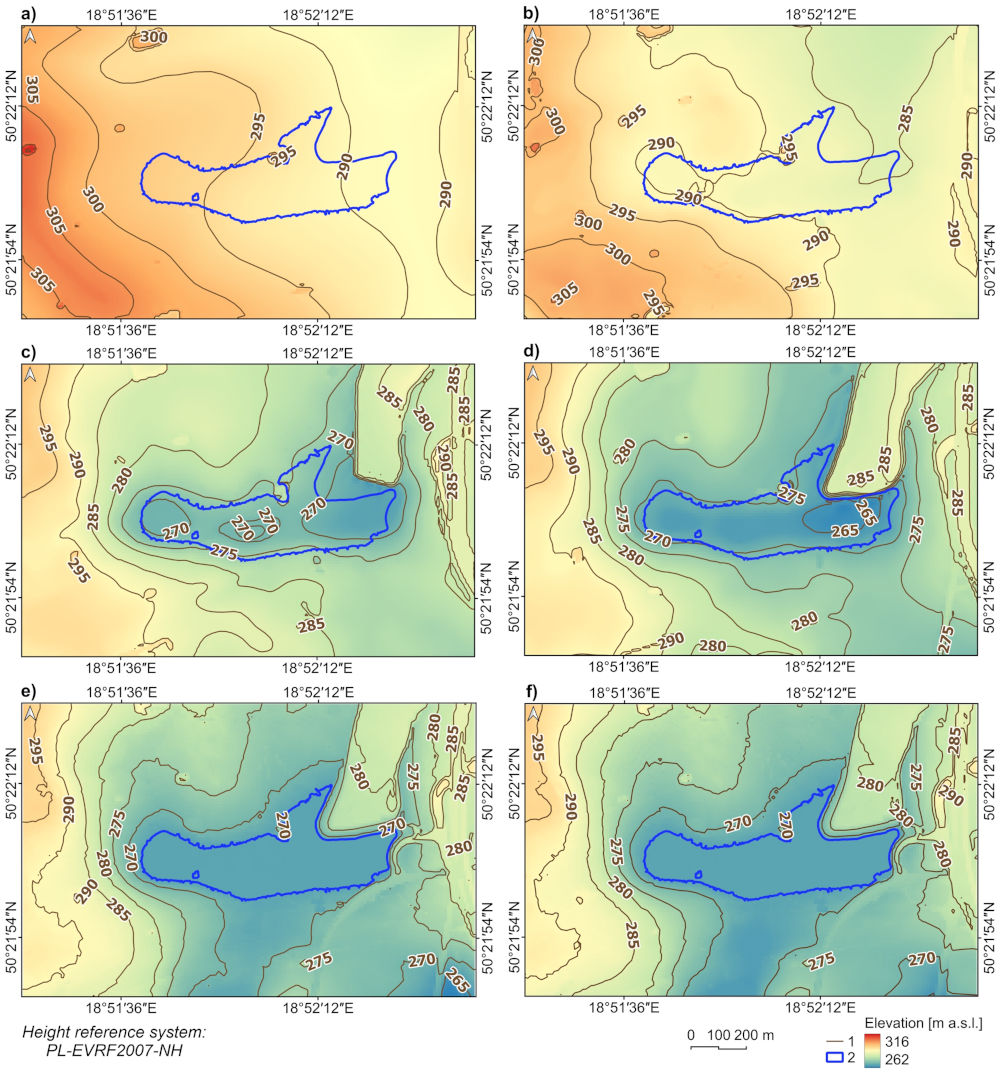
Changes in the terrain elevation near the Brandka Pond in: (a) 1939/1941; (b) 1958/1961; (c) 1983; (d) 1993; (e) 2012; (f) 2019: 1—contour line interval 5 m, 2—Brandka Pond border in 2019.
return to top