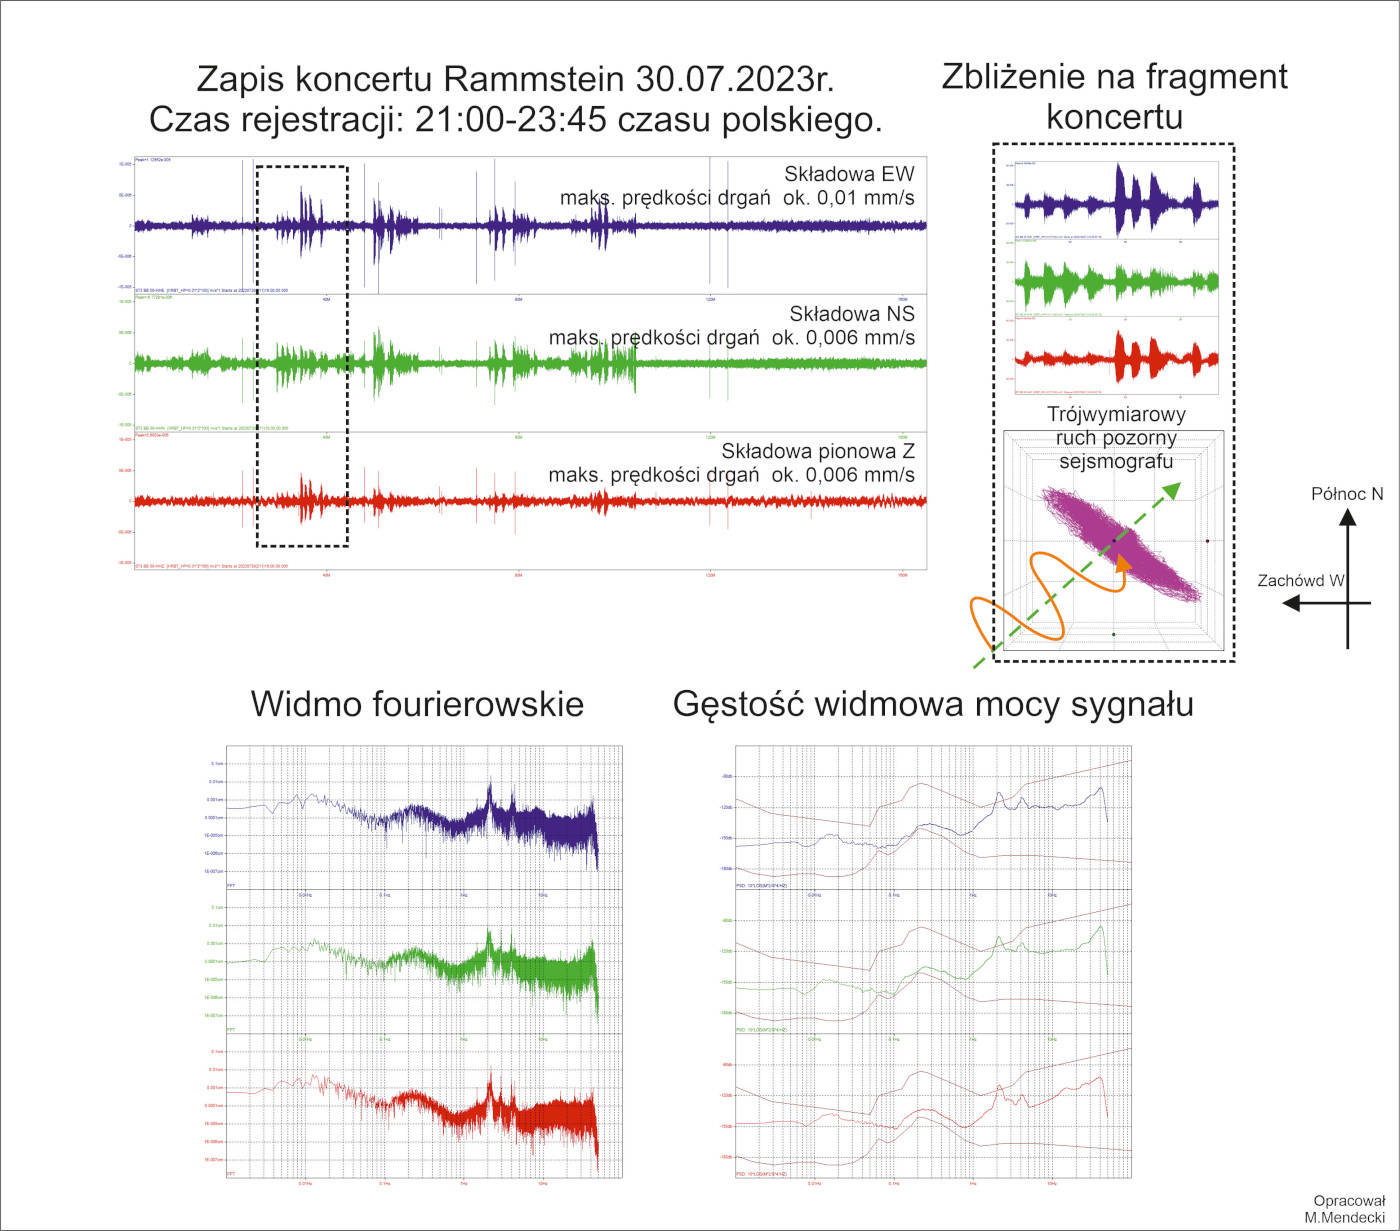
The German band Rammstein performed two concerts at the Silesian Stadium in Chorzów as part of their Europe Stadium Tour. The concerts took place on July 30th and 31st, 2023. Due to the proximity of about 1300 meters between the Silesian Stadium and the Silesian Planetarium, it was possible to record the vibrations caused by this event. A seismograph, belonging to the University of Silesia and installed in the Planetarium as part of the AdriaArray project, monitors seismic activity to study the deep structure of the Earth under the Alps, Carpathians, and Balkan Peninsula.
The relatively short distance between both locations allowed the recording of the vibrations caused by Rammstein’s concert. The complete recording of the concert’s vibrations can be seen in the infographic. During the concert, which lasted over two hours, several “stronger impacts” were distinguishable, with amplitudes exceeding the natural seismic background. The seismograph at the Planetarium measures the velocities of the vibrations. In the infographic, the maximum velocities recorded during the concert were approximately 0.01 mm/s for the east-west horizontal component (EW) and around 0.006 mm/s for the north-south horizontal component (NS) and the vertical component (Z), respectively. Is this a lot? No, nobody at the Planetarium could feel these vibrations, except for the University’s sensor and other seismographs installed there. In the infographic, a small segment is highlighted, starting at around 21:30 Polish time (approximately 19:30 on the infographic, as seismic recordings are made in Coordinated Universal Time, UTC). In this close-up view, eight episodes can be observed: first four weaker ones and then four stronger ones, each lasting a minute or less. Below the close-up view of the concert recording, there is a diagram showing the apparent motion of the seismograph in 3D space. As seen, the displacements of the seismometer had an NW-SE direction, perpendicular to the direction indicating the Stadium’s position relative to the Planetarium, due to the nature of surface waves. The two lower diagrams represent amplitude spectra, specifically Fourier and spectral density. Both spectra show dominant frequencies in the signal at 2.1Hz, 4.1Hz, and 13Hz. Additionally, the spectral density diagram includes boundaries for the lower and upper noise levels. It is unfavourable when the amplitudes exceed the upper limit. For most frequencies on the diagram, the amplitudes fall within the “norms”. Therefore, Rammstein did not cause such an earthquake, but they certainly stirred up excitement among many fans.
Reference:
AdriaArray: https://orfeus.readthedocs.io/en/latest/adria_array_main.html
Planetarium – Śląski Park Nauki: https://www.planetarium.edu.pl/
Planetarium – Facebook: https://www.facebook.com/PlanetariumSlaskie/?locale=pl_PL
Note author: dr Maciej Mendecki


