


Examination of spatial regularities in disease spread is a significant problem in spatial epidemiology. Equally important is the information about changes observed during the relative infection risk. Such an approach enables to follow trends in determined areas (e.g. voivodeships and municipalities), which may facilitate identification of the causes of occurrence of a particular phenomenon and undertaking effective decisions.
Michał Michalak, a doctoral student from the Institute of Earth Sciences at the Faculty of Natural Sciences at the University of Silesia in Katowice, is the author of such an analysis, taking into consideration the epidemiological situation in specific voivodeships in Poland.
|Michał Michalak|
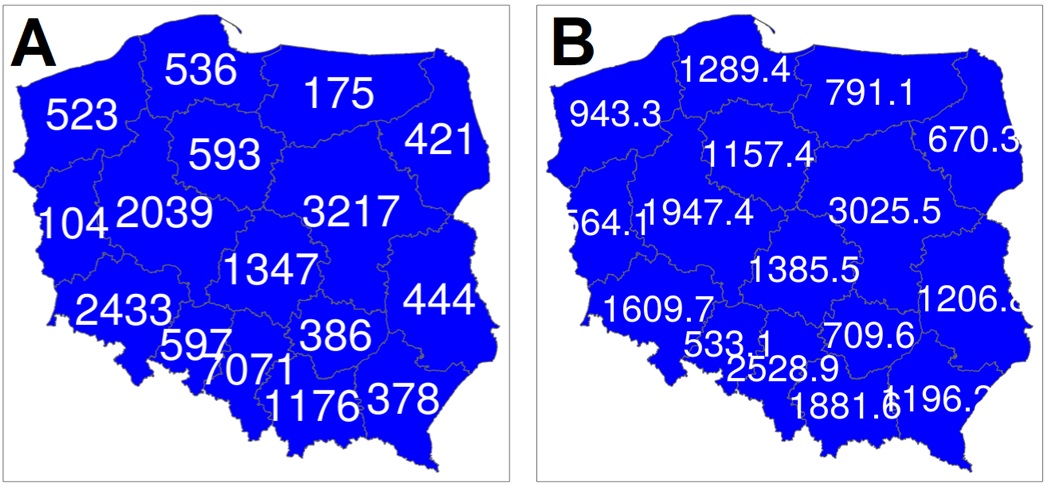
Reports on SARS-CoV-2 coronavirus infection cases usually contain the number of recorded cases in a particular voivodeship (Fig. 1A). However, such information is insufficient, or even confusing, in the context of infection risk assessment in a particular voivodeship. This results from the fact that the number of recorded cases naturally refers to the number of population.
This issue has been partly undertaken by scientists from the University of Silesia – Assoc. Prof. Sławomir Sitek, Assoc. Prof. Elżbieta Zuzańska-Żyśko and Assoc. Prof. Sławomir Pytel. The goal of their paper entitled ‘Distribution and range of SARS-CoV-2 in the Silesian Voivodeship’ was to examine the spatial diversity of recorded infections in the specified region with reference to the number of inhabitants (compare Fig. 1C). The obtained results have revealed significant differences between particular municipalities with regard to such defined characteristics.
Fig. 1 (A): observed number of infection cases; (B) expected number of infection cases; (C) calculated infection cases per 100,000 inhabitants; (D) relative infection risk. Status as of 25 May 2020, 10:00, taking into consideration the history of infections in the preceding days. Prepared by Michał Michalak.
In spatial epidemiology, however, we can examine not only spatial regularities, but also spatio-temporal regularities in different scales (on the level of a country, voivodeship, district, etc.). Thanks to including the time factor, it is possible to identify the causes behind specific trends in a more appropriate manner, which has a significant impact on the effective crisis management. Moreover, the methods developed in this field allow to check to what extent infections take the form of clusters.
Such classic spatial epidemiology methods require calculating the value expected for each voivodeship (Fig. 1B), and comparing them with the observed number of cases (Fig. 1A). This is also a way to calculate a new indicator: relative risk infection (Fig. 1D). Values above 1 on a relevant map of relative risk mean higher-than-average incidence risk. It may indicate the existence of infection clusters or increased number of people susceptible to infection, for example the elderly. From the perspective of crisis coordination, values equal to 1 in all subareas would be positive information: infection occur independently – the patients are not infected in groups.
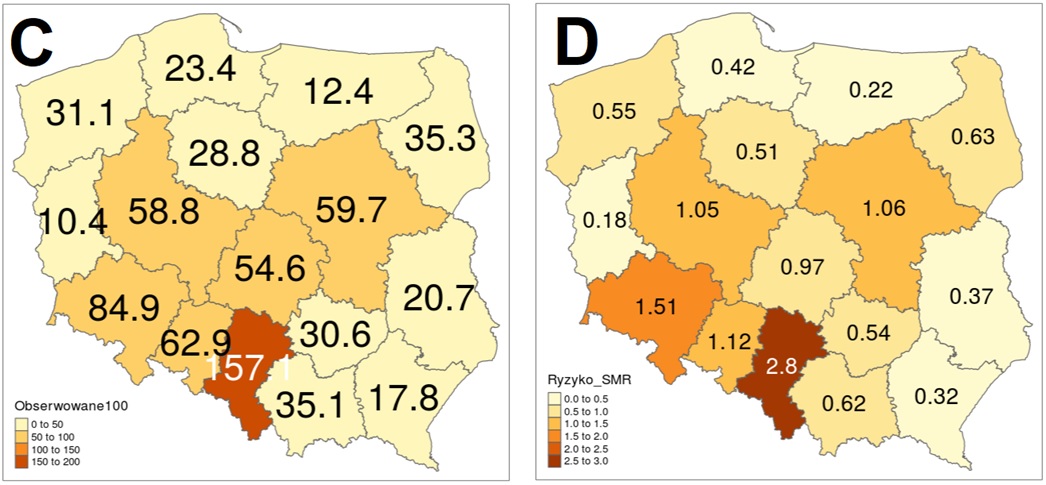
Relative risk estimation can be performed in many ways. The simplest version assumes that the expected value and subsequent indicators are calculated separately for each day, according to the reported number of new infections on a specific day (Fig. 2).
Fig. 2 Relative risk infection based on the number of infections on a particular day (without taking into consideration the previous history). Status as of 28 May 2020. Prepared by Michał Michalak.
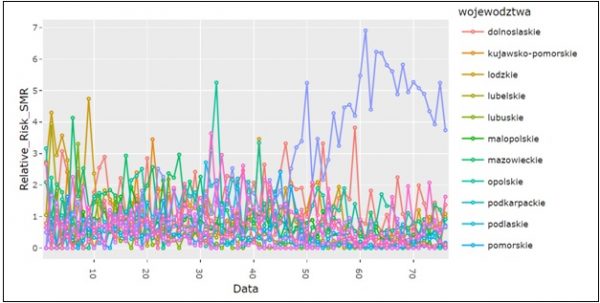
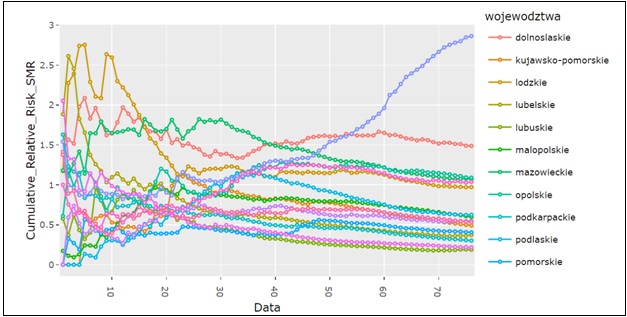
Although such an approach is useful for monitoring the current situation, it has no sufficient potential to provide information about trends. Therefore, another version of calculating these indicators for a specific day includes the history of infections from the preceding days. In this way we obtain more smoothed courses of curves. Based on the example of the Silesian Voivodeship, it may be noted that the relative risk curve has been constantly growing from 11 April (Fig. 3). Exploring the reasons behind this effect would require carrying out an analogous procedure on a smaller scale.
Fig. 3 Relative risk for a particular day, taking into consideration the previous history of infections. Status as of 28 May 2020. Prepared by Michał Michalak.
Although the proposed method of informing about infections demonstrates certain advantages above the forms of reporting, it should be noted that there are more advanced approaches, which are included in the so-called Bayes methods. They enable a more refined prediction of the examined indicators based on the historical and new data.
The above diagrams are available in the Internet app on: https://michalmichalak997.shinyapps.io/shiny_corona/ . Unfortunately, due to the corrections introduced by the Ministry of Health, full automation of monitoring is not possible, and the data are updated irregularly. The user has the option to upload their own data for a specific day.
Sources and resources:
- Bivand, R. S., Pebesma, E. J., Gomez-Rubio, V., & Pebesma, E. J. (2008). Applied spatial data analysis with R (Vol. 747248717). New York: Springer
- Ministry of Health https://twitter.com/MZ_GOV_PL
App with diagrams https://michalmichalak997.shinyapps.io/shiny_corona/

Contact
Michał Michalak, doctoral student from the Institute of Earth Sciences at the University of Silesia: mimichalak@us.edu.pl