

| dr hab. Sławomir Sitek, dr hab. Sławomir Pytel, prof. UŚ, dr hab. Elżbieta Zuzańska-Żyśko, prof. UŚ |
In view of the global phenomenon with local and regional aspects, the spread of coronavirus infections in the Silesian Voivodeship, which has specific spatial dimensions, has been analysed. Due to the large concentration of population, the set of interconnected large and medium-sized cities, as well as commuter flows, this region is among the areas of the biggest social and economic potential in Poland. These conditions are reflected in the current situation related to COVID-19 epidemiological threat.
From the socioeconomic point of view, the crucial role in the spread of epidemic is played by the high population density and urbanisation index in the region (78% of the population live in the cities; there are 365 inhabitants per one square kilometre), complex and interconnected settlement (conurbation), as well as location of many business entities, including huge companies in various industries. The number of health care units (especially hospitals) and their distribution in the region (79 hospitals only in the central part of the region[1])
and residential homes where elderly people and individuals with health issues stay. Another group of factors is the behavioural circumstances of inhabitants and their network of family, social and professional connections, which may affect the course of epidemic.
Data sources and analysis methods
The material is based on the information from sanitary and epidemiological stations in the Silesian Voivodeship. The data refer to the status as of 18 May 2020, except for the Racibórz County (data as of 17 May 2020). The analysis was carried out in two spatial dimensions: counties and communes. With reference to counties, the phenomenon was presented in absolute figures and per 100,000 inhabitants. In the case of communes, the data calculated as per 100,000 inhabitants were used, and a separate map was prepared to show the communes with no active cases of infections.
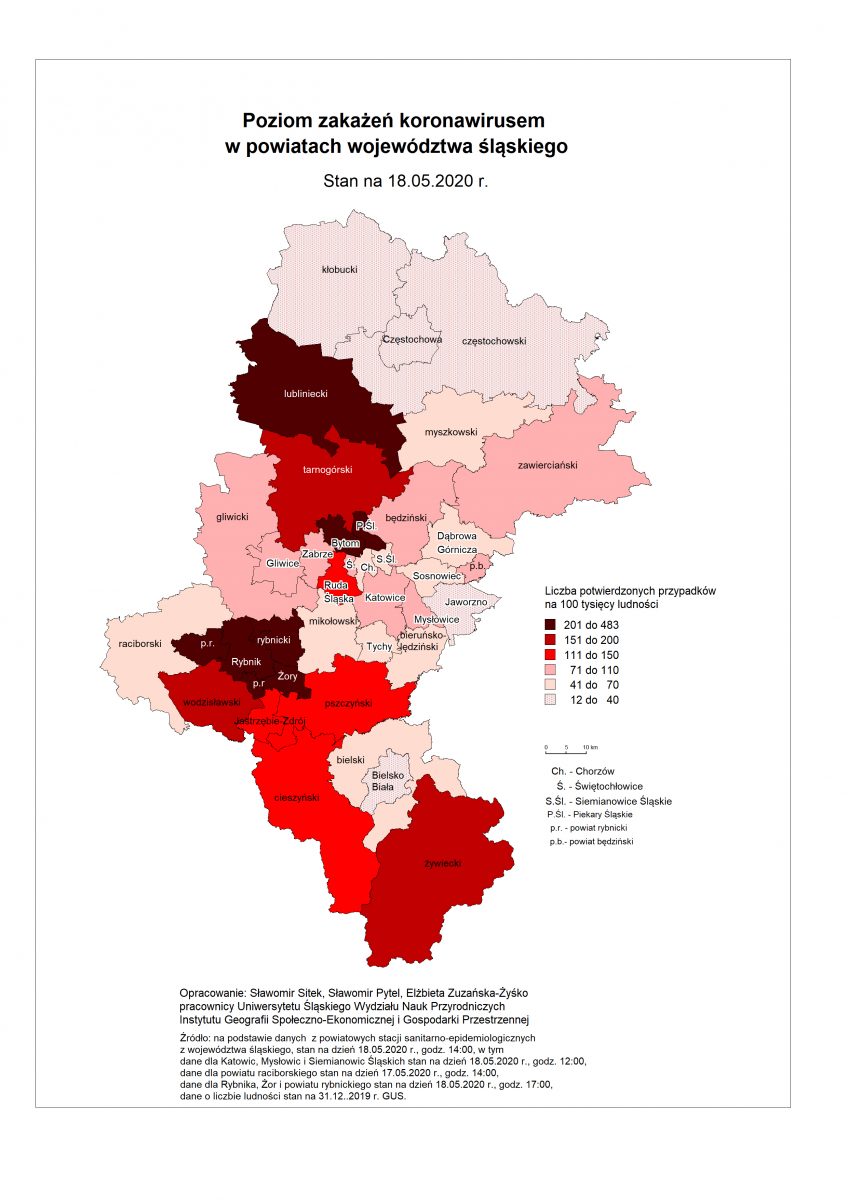
Spatial distribution of confirmed cases of coronavirus in counties of the Silesian Voivodeship
The distribution of coronavirus infections in the Silesian Voivodeship is very diverse. To a large extent, it is related to the cases of infections in residential homes and hard coal mines. It is also a result of the increased number of tests performed (i.e. almost 60,000[2].
At the level of counties, the biggest number of coronavirus incidence was confirmed in Bytom (657 cases). This was influenced both by incidence among miners and residents of residential homes. To give an example, over 60 people were diagnosed positive in one residential home (DPS ‘Kombatant’)[3]. Similarly, the situation got so serious in one of the health care units that the decision was taken to test all employees of Szpital Wojewódzki (Provincial Hospital) no. 4 in Bytom, which resulted in diagnosing over 30 cases[4]. DThere was also a high incidence in Lubliniec County (369) and Rybnik County (343). More than 200 infections were recorded in Katowice and the following counties: Żywiec, Tarnowskie Góry, Wodzisław and Cieszyn.
Over 3,000 coronavirus cases have been confirmed among the miners[5]. Since there are no more coal mines in the cities of Zagłębie Dąbrowskie, there is no exposure to incidence in such plants. However, we cannot generalise too much, because the infections do not occur in every coal mine.
With regard to counties, the smallest incidence is in Jaworzno (11 cases), Siemianowice Śląskie (28 cases) and Kłobuck (31 cases).
Due to the differences between the number of population in particular counties, the analysis should be performed per 100,000 inhabitants. Then we obtain comparable values, which are not distorted by the unit size. In such case, there are three areas with the values exceeding over 150 cases per 100,000 inhabitants. The first area is Lubliniec County, Tarnowskie Góry County, Bytom and Piekary Śląskie; the second area is Rybnik, Rybnik County, Żory and Wodzisław County; and the third area is Żywiec County.
We can also distinguish the areas characterised by the lowest number of coronavirus cases. The first one is: Częstochowa County, Kłobuck County and Częstochowa. The second area, located in the central part of the Silesian Voivodeship, includes Dąbrowa Górnicza, Sosnowiec, Jaworzno, Tychy, Bieruń and Lędziny County, as well as Mikołów County. The third area is Bielsko-Biała County and Bielsko-Biała.
It turns out that areas with the largest incidence are directly adjacent to the areas with the smallest number of cases (Fig. 2). An example is the Lubliniec County that borders with Kłobuck County and Częstochowa County. Similar is the case of border between Bielsko-Biała and Bielsko-Biała County with Żywiec County. There are also strong contrasts within the Silesian Metropolis, e.g. between Bytom and Chorzów. This may prove the local nature of the development of the phenomenon.
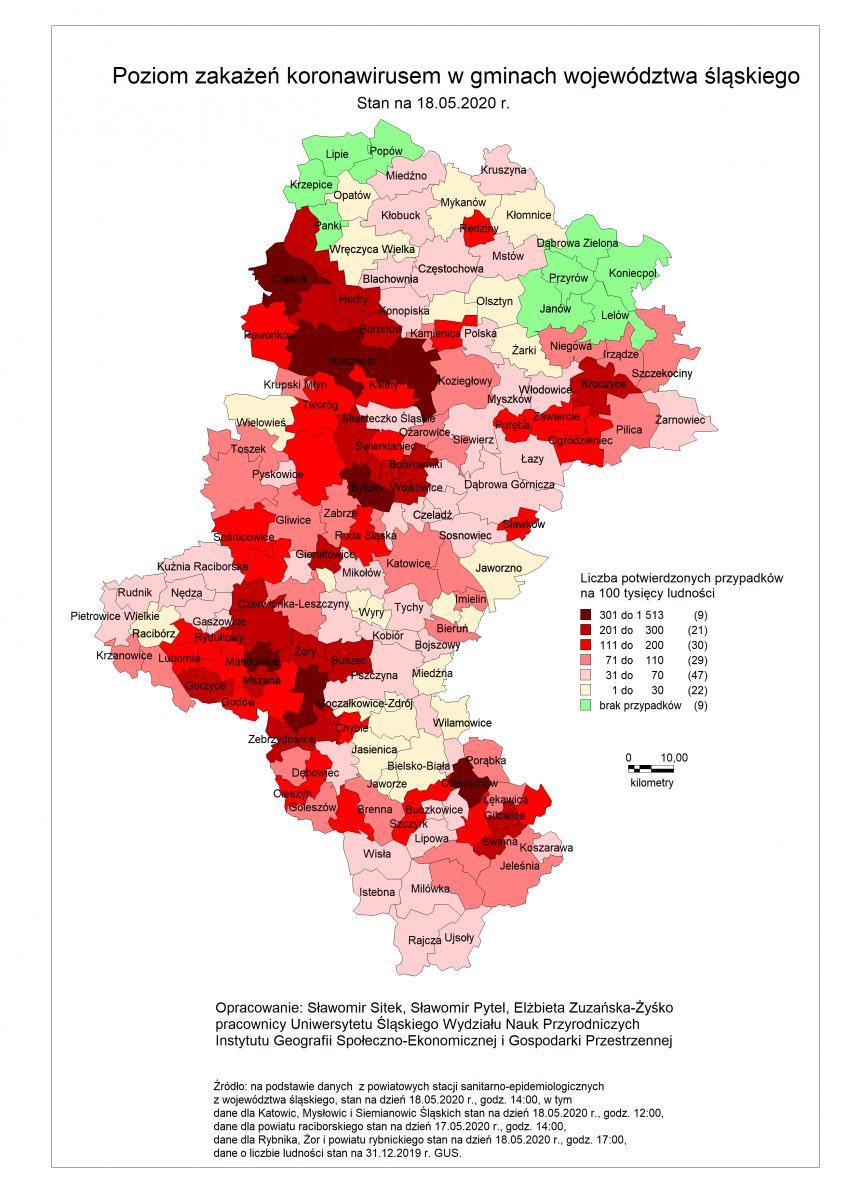
Spatial distribution of confirmed coronavirus cases in particular communes of the Silesian Voivodeship
The worst result per 100,000 inhabitants is in Czernichów in the Żywiec County, where the incidence rate has the record level of 1,513 cases per 100,000 inhabitants. Second in this category is Woźniki in Lubliniec County (915 infections per 100,000 inhabitants) and Świerklany in Rybnik County (793 cases per 100,000 inhabitants). Comparable levels above 500 cases per 100,000 inhabitants were recorded in Koszęcin and Lubliniec. The cases of Czernichów, Woźniki, Koszęcin and Lubliniec are related to infections in residential homes and nursing homes, whereas Świerklany is the effect of infections among the coal mine employees.
The values of recorded cases per 100,000 inhabitants in particular communes show variety within counties. For example, in Żywiec County and Cieszyn County, the communes located more to the south demonstrated a lower level of incidence. The topography of the area – mountainous terrains, dense forest cover and lower population density – may affect the level of infections. There are also local maximum incidence levels, e.g. Rędziny in Częstochowa County and Kroczyce in Zawiercie County.
When grouping communes according to the level of phenomenon, the conclusion is that the biggest group of 47 communes has values within the range of 31-70 cases per 100,000 inhabitants. There are 9 communes both within the highest incidence group (above 301 cases per 100,000 inhabitants), as well as in the group without any confirmed infection cases.
In the Silesian Voivodeship, as of 18 May 2020, there were no active coronavirus cases in 22 communes. Among them, no cases at all were recorded in 9 communes, whereas in 13 further communes there were infections, but the patients have already recovered. Unfortunately, there were also three mortalities in these communes.
The communes without confirmed coronavirus cases are concentrated in the northern part of the Silesian Voivodeship: Częstochowa County and Kłobuck County. In Silesia Metropolis, the only commune without active cases is Chełm Śląski. There are also several virus-free communes in Bielsko County (Buczkowice, Szczyrk), Koszarawa in Żywiec County, Krzanowice in Racibórz County and Krupski Młyn in Tarnowskie Góry County. A common feature in a majority of these communes is the peripheral location. There is also usually a lower population density, whereas from the economic point of view, agriculture has a higher share in employment.
Summary
The presented material proves that the Silesian Voivodeship, which has the highest number of infections, is not homogeneous in this respect. The coronavirus-free communes occupy the area of 14.8% of the Silesian Voivodeship surface and are inhabited by 3.5% of the overall population. This situation has been caused by different reasons: infection occurrence in care centres, hospitals and among coal mine employees. We should also avoid taking mental shortcuts and identifying coronavirus incidence only with such facilities. We must also be aware that the phenomenon could look different if a higher number of tests were performed in various cities, and their distribution was more proportional.
Indicating the outbreaks of numerous infections is intended to support the process of monitoring epidemic, and in no case can be understood as stigmatising particular communes and their inhabitants. This needs to be emphasized, because there are certain signs showing that such situations do take place, not only within Poland, but also in international relations
The purpose of socioeconomic geography research is to search for cause and effect links, as well as spatial distribution of various phenomena in the relations between humans, economy and environment. At this point, there are more questions than answers regarding the current epidemic. The phenomenon is still new, and there are no complete data concerning the structure of people suffering from coronavirus. There is also not enough knowledge, for example about the range of commuting, which may result in horizontal transmission of the phenomenon. The problem of data availability is common for the scientists.
As a result of further research, it may turn out that the course and spread of this disease is random and has no specific connection with the socioeconomic characteristics of the region. Even so, negative verification also has its value. In such case, the suitability of spatiotemporal analyses is limited to its information and management dimension, indicating the process of spatial diffusion of this phenomenon.
We think that analyses at the level of both counties and communes should be performed continuously, supporting state and self-government agencies in fighting against the pandemic. We see this as the real usefulness of science and its extension to society and economy. We perceive it as the role for geographers, assuming at the same time that monitoring should be carried out by interdisciplinary teams of scientists. We also express the common wish that this subject should no longer be valid, and the pandemic is over.
Źródła danych:
Data from county sanitary and epidemiological stations in the Silesian Voivodeship, status as of 18 May 2020, 14:00, including:
- data for Katowice, Mysłowice and Siemianowice Śląskie – status as of 18 May 2020, 12:00,
- data for Racibórz County – status as of 17 May 2020, 14:00,
- data for Rybnik, Żory and Rybnik District – status as of 18 May 2020, 17:00.
Population. Status and structure of population, and natural mobility by territorial division in 2019. Status as of 31 December, Statistics Poland.
Prof. Sławomir Sitek, Prof. Sławomir Pytel, Prof. Elżbieta Zuzańska-Żyśko – employees of the Institute of Social and Economic Geography and Spatial Management at the Faculty of Natural Sciences at the University of Silesia in Sosnowiec. They focus on multidimensional research in the field of local and regional development, population migrations, problems of seniors and ageing of society, labour market and functional and spatial processes, including urbanisation and metropolisation in the region, in Poland and around the world.